This change greatly reduces the size of saved dumps, but increase the
cost of processing during loading. One notable outlier in the dataset
below is mem.tracy, which increased in size, even if changes in the
memory dump saving scheme decrease size of the other traces.

041/aa.tracy (0.4.1) {18987 KB} -> 042/aa.tracy (0.4.2) {10140 KB}  53.40% size change
041/android.tracy (0.4.1) {696753 KB} -> 042/android.tracy (0.4.2) {542738 KB}  77.90% size change
041/asset-new.tracy (0.4.1) {97163 KB} -> 042/asset-new.tracy (0.4.2) {78402 KB}  80.69% size change
041/asset-new-id.tracy (0.4.1) {105683 KB} -> 042/asset-new-id.tracy (0.4.2) {84341 KB}  79.81% size change
041/asset-old.tracy (0.4.1) {100205 KB} -> 042/asset-old.tracy (0.4.2) {80688 KB}  80.52% size change
041/big.tracy (0.4.1) {2246014 KB} -> 042/big.tracy (0.4.2) {943083 KB}  41.99% size change
041/crash.tracy (0.4.1) {143 KB} -> 042/crash.tracy (0.4.2) {131 KB}  91.39% size change
041/crash2.tracy (0.4.1) {3411 KB} -> 042/crash2.tracy (0.4.2) {1425 KB}  41.80% size change
041/darkrl.tracy (0.4.1) {31818 KB} -> 042/darkrl.tracy (0.4.2) {15897 KB}  49.96% size change
041/darkrl2.tracy (0.4.1) {18778 KB} -> 042/darkrl2.tracy (0.4.2) {8002 KB}  42.62% size change
041/darkrl-old.tracy (0.4.1) {151346 KB} -> 042/darkrl-old.tracy (0.4.2) {67945 KB}  44.89% size change
041/deadlock.tracy (0.4.1) {53 KB} -> 042/deadlock.tracy (0.4.2) {52 KB}  98.55% size change
041/gn-opengl.tracy (0.4.1) {45860 KB} -> 042/gn-opengl.tracy (0.4.2) {30983 KB}  67.56% size change
041/gn-vulkan.tracy (0.4.1) {45618 KB} -> 042/gn-vulkan.tracy (0.4.2) {31349 KB}  68.72% size change
041/long.tracy (0.4.1) {1583550 KB} -> 042/long.tracy (0.4.2) {1225316 KB}  77.38% size change
041/mem.tracy (0.4.1) {1243058 KB} -> 042/mem.tracy (0.4.2) {1369291 KB}  110.15% size change
041/multi.tracy (0.4.1) {14519 KB} -> 042/multi.tracy (0.4.2) {8110 KB}  55.86% size change
041/new.tracy (0.4.1) {1439 KB} -> 042/new.tracy (0.4.2) {1108 KB}  77.01% size change
041/q3bsp-mt.tracy (0.4.1) {1414323 KB} -> 042/q3bsp-mt.tracy (0.4.2) {949855 KB}  67.16% size change
041/q3bsp-st.tracy (0.4.1) {301334 KB} -> 042/q3bsp-st.tracy (0.4.2) {240347 KB}  79.76% size change
041/selfprofile.tracy (0.4.1) {399648 KB} -> 042/selfprofile.tracy (0.4.2) {197713 KB}  49.47% size change
041/tbrowser.tracy (0.4.1) {13052 KB} -> 042/tbrowser.tracy (0.4.2) {9503 KB}  72.81% size change
041/test.tracy (0.4.1) {60309 KB} -> 042/test.tracy (0.4.2) {40700 KB}  67.49% size change
041/virtualfile_hc.tracy (0.4.1) {108967 KB} -> 042/virtualfile_hc.tracy (0.4.2) {72839 KB}  66.85% size change
041/zfile_hc.tracy (0.4.1) {58814 KB} -> 042/zfile_hc.tracy (0.4.2) {39608 KB}  67.35% size change
Tracy Profiler
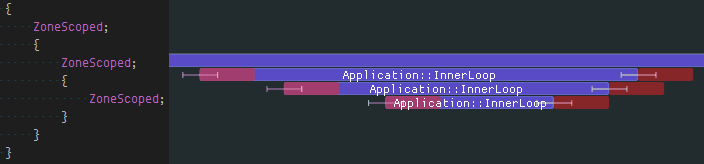
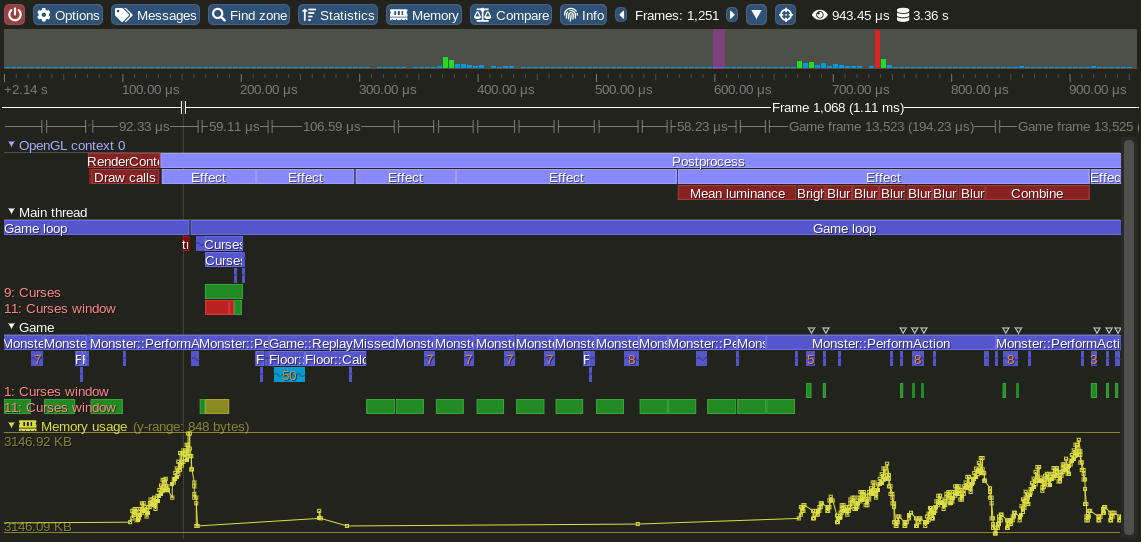
Tracy is a real time, nanosecond resolution frame profiler that can be used for remote or embedded telemetry of your application. It can profile CPU (C++, Lua), GPU (OpenGL, Vulkan) and memory. It also can display locks held by threads and their interactions with each other.
Tracy requires compiler support for C++11, Thread Local Storage and a way to workaround static initialization order fiasco. There are no other requirements. The following platforms are confirmed to be working (this is not a complete list):
- Windows (x86, x64)
- Linux (x86, x64, ARM, ARM64)
- Android (ARM, x86)
- FreeBSD (x64)
- Cygwin (x64)
- WSL (x64)
- OSX (x64)
The following compilers are supported:
- MSVC
- gcc
- clang
Introduction to Tracy Profiler v0.2
New features in Tracy Profiler v0.3
New features in Tracy Profiler v0.4
High-level overview

Tracy is split into client and server side. The client side collects events using a high-efficiency queue and awaits for an incoming connection. The server part connects to client and receives collected data from the client, which is then reconstructed into a viewable timeline. The transfer is performed using a TCP connection.
Performance impact
To check how much slowdown is introduced by using Tracy, I have profiled etcpak, which is the fastest ETC texture compression utility there is. I used an 8192×8192 test image as input data and instrumented everything down to the 4×4 pixel block compression function (that's 4 million blocks to compress). It should be noted that Tracy needs to calibrate its internal timers at each run. This introduces a delay of 115 ms (on my machine), which is negligible when doing lengthy profiling runs, but it skews the results of etcpak timing. The following times have this delay subtracted, to give focus on zone collection impact, which is the thing that really matters here.
| Scenario | Zones | Clean run | Profiling run | Difference |
|---|---|---|---|---|
| Compression of an image to ETC1 format | 4194568 | 0.94 s | 1.003 s | +0.063 s |
| Compression of an image to ETC2 format, with mip-maps | 5592822 | 1.034 s | 1.119 s | +0.085 s |
In both scenarios the per-zone time cost is at ~15 ns. This is in line with the measured 8 ns single event collection time (each zone has to report start and end event).
Usage instructions
The user manual for Tracy is available at the following address. It provides information about the integration process, required code markup and so on.
Features
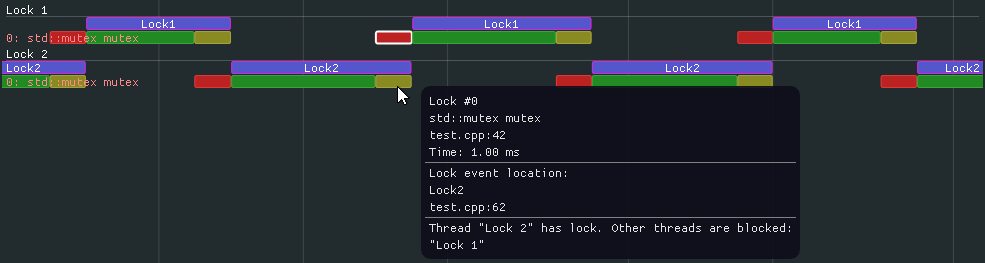
Marking locks
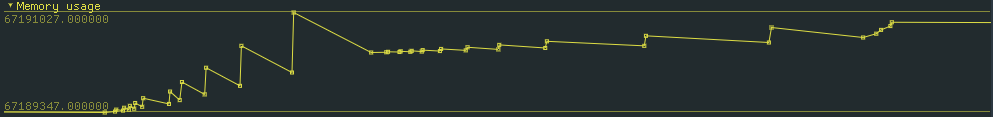
Plotting data
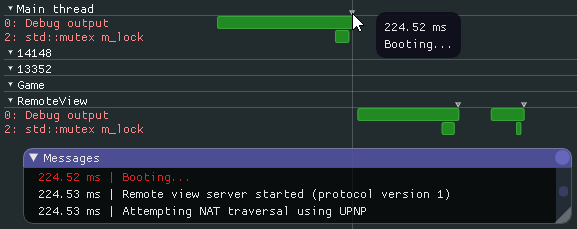
Message log
Approximation of capture cost